
DevOps Basic Principles and Practices
Table of Contents
Introduction
DevOps has become a game-changer in today’s ever changing technology scene, where efficiency and agility are critical. It transforms software development, testing, and deployment processes and encourages cooperation between operations and development teams to produce high-caliber products more quickly. We go deeply into the underlying ideas and procedures of DevOps in this extensive guide, clarifying its fundamental ideas and offering practical advice accompanied by real-world code samples.
Chapter 1: Understanding the Essence of DevOps
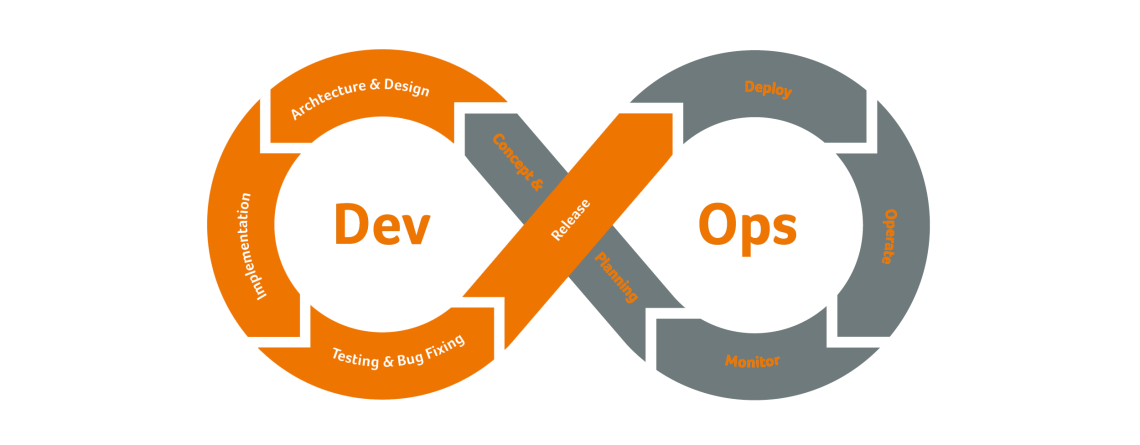
Across the whole software development lifecycle (SDLC), DevOps stresses collaboration, automation, and continuous improvement. It is more than just a technique. Fundamentally, the goal of DevOps is to eliminate boundaries between teams working on development and operations in order to promote a shared accountability and responsibility culture. We’ll examine the fundamental ideas of DevOps in this chapter and provide practical code samples to support our points.
1.1 Collaboration
The value of cooperation and communication between operations, development, and other stakeholders in the software delivery process is emphasized by DevOps. Faster feedback loops and more seamless handoffs between phases of the SDLC are made possible by DevOps through the promotion of cross-functional teams and the removal of organizational boundaries.
Code Example 1: Using Git for Collaborative Development
# Clone a Git repository
git clone https://github.com/example/repository.git

# Create a new branch for feature development
git checkout -b feature-branch

# Make changes to the codebase
# Commit changes to the local repository
git add .
git commit -m "Implement feature X"

# Push changes to the remote repository
git push origin feature-branch

# Create a pull request to merge changes into the main branch
In this example, developers collaborate on a codebase using Git, a distributed version control system. They create feature branches, make changes to the codebase, and collaborate on new features by creating pull requests and reviewing each other’s code.
1.2 Automation
The foundation of DevOps is automation, which helps businesses automate repetitive processes, lower manual error rates, and release software more quickly. Across the whole software delivery pipeline, automation helps teams become more efficient, consistent, and reliable in tasks like infrastructure provisioning, configuration management, testing, and deployment.
Code Example 2: Automating Deployment with Shell Scripts
#!/bin/bash

# Build the application
mvn clean package

# Deploy the application to a remote server
scp target/my-application.jar user@example.com:/path/to/deployment/directory
In this example, a shell script automates the deployment of a Java application to a remote server. The script builds the application using Apache Maven and then copies the resulting JAR file to the deployment directory on the remote server using SSH.
1.3 Continuous Integration and Continuous Deployment (CI/CD)
To deliver software updates fast and reliably, continuous integration (CI) and continuous deployment (CD), two essential DevOps methods, include automating the build, test, and deployment processes.
Code Example 3: Setting up CI/CD Pipeline with Jenkins
pipeline {
    agent any

    stages {
        stage('Build') {
            steps {
                sh 'mvn clean package'
            }
        }
        stage('Test') {
            steps {
                sh 'mvn test'
            }
        }
        stage('Deploy') {
            steps {
                sh 'scp target/my-application.jar user@example.com:/path/to/deployment/directory'
            }
        }
    }
}
Code changes in this example of a Jenkins pipeline cause automatic builds, tests, and deployments. The pipeline is divided into phases for testing, creating, and deploying the application to a remote server. Teams may make sure that code changes are verified and deployed consistently and reliably by automating these procedures.
The core concepts of DevOps, including as cooperation, automation, and continuous integration and deployment, have all been covered in this chapter. We’ve demonstrated how DevOps methods may be applied to optimize software delivery procedures, improve communication between development and operations teams, and hasten the release of high-quality software using practical code samples. We’ll go deeper into certain DevOps principles and methodologies in the upcoming chapters, offering helpful advice and actionable insights to assist you as you start your DevOps journey.
Chapter 2: Continuous Integration and Continuous Deployment (CI/CD)
Continuous Integration (CI) and Continuous Deployment (CD), which enable businesses to automate the build, test, and deployment processes in order to provide software changes quickly and reliably, are fundamental components of the DevOps paradigm. In order to show how the CI/CD ideas are used, this chapter will analyze them and provide real-world code samples.
2.1 Continuous Integration (CI)
The process of regularly, typically many times a day, merging code changes into a common repository is known as continuous integration. An automated build process that comprises code compilation, automated test execution, and artifact generation is started by each integration.
Code Example 1: Setting up CI Pipeline with GitHub Actions
name: CI

on:
  push:
    branches:
      - main
  pull_request:
    branches:
      - main

jobs:
  build:
    runs-on: ubuntu-latest

    steps:
    - name: Checkout code
      uses: actions/checkout@v2

    - name: Set up JDK 11
      uses: actions/setup-java@v2
      with:
        java-version: '11'

    - name: Build with Maven
      run: mvn -B clean verify
In this GitHub Actions workflow example, the CI pipeline is triggered on pushes to the main branch or pull requests targeting the main branch. It checks out the code, sets up Java Development Kit (JDK) 11, and builds the project using Apache Maven.
2.2 Continuous Deployment (CD)
By automating the deployment of code changes to production environments once they have gone through the CI process, Continuous Deployment expands upon the concepts of Continuous Integration. Its goal is to shorten the time lag between code modifications and production deployment, allowing companies to roll out updates and new features more quickly and reliably.
Code Example 2: Setting up CD Pipeline with AWS CodePipeline
Resources:
  MyPipeline:
    Type: AWS::CodePipeline::Pipeline
    Properties:
      RoleArn: !GetAtt PipelineRole.Arn
      Stages:
        - Name: Source
          Actions:
            - Name: SourceAction
              ActionTypeId:
                Category: Source
                Owner: AWS
                Provider: GitHub
                Version: 1
              Configuration:
                Owner: myGitHubOwner
                Repo: myGitHubRepo
                Branch: main
                OAuthToken: !Ref GitHubToken
              OutputArtifacts:
                - Name: SourceOutput
        - Name: Build
          Actions:
            - Name: BuildAction
              ActionTypeId:
                Category: Build
                Owner: AWS
                Provider: CodeBuild
                Version: 1
              Configuration:
                ProjectName: myCodeBuildProject
              InputArtifacts:
                - Name: SourceOutput
              OutputArtifacts:
                - Name: BuildOutput
        - Name: Deploy
          Actions:
            - Name: DeployAction
              ActionTypeId:
                Category: Deploy
                Owner: AWS
                Provider: ECS
                Version: 1
              Configuration:
                ClusterName: myEcsCluster
                ServiceName: myEcsService
              InputArtifacts:
                - Name: BuildOutput
An AWS CodePipeline for continuous deployment to Amazon Elastic Container Service (ECS) is defined by this AWS CloudFormation template. Three steps make up the pipeline: source, build, and deploy. It downloads the project’s source code from GitHub, uses AWS CodeBuild to compile it, and then distributes the artifacts to an ECS cluster.
Two essential DevOps approach methods, Continuous Integration and Continuous Deployment, have been covered in this chapter. Organizations may more effectively respond to customer input and market needs by delivering software updates fast and reliably through the automation of the build, test, and deployment processes. We’ll explore further facets of DevOps in the upcoming chapters and offer more advice on applying DevOps techniques in practical settings.
Chapter 3: Infrastructure as Code (IaC)
IaC, a cornerstone of DevOps, entails orchestrating and provisioning infrastructure resources via machine-readable definition files. By conceptualizing infrastructure as code, enterprises streamline setup and configuration processes, enhancing consistency, scalability, and fostering collaboration between development and operations teams. Throughout this chapter, we will delve into the foundational principles of IaC and offer tangible code examples to demonstrate its practical application.
3.1 Infrastructure Provisioning with Shell Scripts
Shell scripts are a simple yet powerful tool for automating the provisioning and configuration of infrastructure resources. By using shell scripts, organizations can define infrastructure resources and their configurations in a declarative manner and execute them using command-line tools.
Code Example 1: Provisioning AWS EC2 Instance with Shell Script
#!/bin/bash

# Define variables
AMI="ami-0c55b159cbfafe1f0"
INSTANCE_TYPE="t2.micro"
REGION="us-east-1"
KEY_NAME="my-key-pair"

# Create EC2 instance
aws ec2 run-instances \
  --image-id $AMI \
  --instance-type $INSTANCE_TYPE \
  --region $REGION \
  --key-name $KEY_NAME
In this example, a shell script uses the AWS Command Line Interface (CLI) to provision an EC2 instance on Amazon Web Services (AWS). The script defines variables for the AMI ID, instance type, region, and key pair, and then uses the aws ec2 run-instances command to create the EC2 instance.
3.2 Configuration Management with Ansible
Ansible is a powerful automation tool that can be used for configuration management, application deployment, and infrastructure orchestration. With Ansible, organizations can define infrastructure configurations in YAML files called playbooks and execute them to automate the setup and configuration of infrastructure resources.
Code Example 2: Configuring Nginx Server with Ansible Playbook
---
- name: Configure Nginx server
  hosts: web_servers
  tasks:
    - name: Install Nginx
      apt:
        name: nginx
        state: present

    - name: Start Nginx service
      service:
        name: nginx
        state: started
In this example, a Nginx server is configured using an Ansible playbook. The playbook outlines how to use the apt module to install the Nginx package and the service module to launch the Nginx service. One or more target hosts listed in the hosts section may be used to run the playbook.
3.3 Container Orchestration with Docker Compose
Docker Compose is a tool for defining and running multi-container Docker applications. With Docker Compose, organizations can define infrastructure configurations in YAML files called docker-compose.yml and use them to orchestrate the deployment and management of containerized applications.
Code Example 3: Defining Docker Compose Configuration for Microservices
version: '3'
services:
  web:
    image: nginx:latest
    ports:
      - "80:80"
  api:
    image: my-api:latest
    ports:
      - "8080:8080"
    environment:
      - DATABASE_URL=postgres://user:password@db:5432/db
  db:
    image: postgres:latest
    environment:
      - POSTGRES_USER=user
      - POSTGRES_PASSWORD=password
      - POSTGRES_DB=db
A HTTP server, an API service, and a PostgreSQL database make up the multi-service application in this example, which is defined by a Docker Compose configuration. Docker Compose may be used for the deployment and management of each service, which is specified with its image, ports, and environment variables.
We have discussed Infrastructure as Code (IaC) in this chapter and included practical code samples to demonstrate its use. Organizations may automate the provisioning and configuration of infrastructure resources, gain higher consistency and scalability, and enhance cooperation between development and operations teams by utilizing tools and processes including shell scripts, Ansible, and Docker Compose. We’ll explore further facets of DevOps in the upcoming chapters and offer more advice on applying DevOps techniques in practical settings.
Chapter 4: Monitoring and Logging
DevOps requires logging and monitoring in order to give enterprises insight into the health and performance of their infrastructure and applications. Organizations may increase the dependability and efficiency of their systems by proactively identifying issues, debugging difficulties, and making data-driven choices by putting strong monitoring and logging solutions in place. This chapter will cover the fundamentals of logging and monitoring and will include practical code examples to demonstrate how they are applied.
4.1 Monitoring with Prometheus and Grafana
Prometheus serves as an open-source monitoring and alerting toolkit, meticulously crafted for reliability and scalability. Meanwhile, Grafana, a visualization tool frequently paired with Prometheus, specializes in crafting dynamic dashboards and graphs, tailored for monitoring metrics. By harmonizing Prometheus with Grafana, organizations gain access to a formidable solution capable of vigilantly monitoring both applications and infrastructure with precision and efficacy.
Code Example 1: Configuring Prometheus to Scrape Metrics from a Target
global:
  scrape_interval: 15s

scrape_configs:
  - job_name: 'node_exporter'
    static_configs:
      - targets: ['localhost:9100']
The present instance demonstrates how a Prometheus configuration file designates a scrape job called ‘node_exporter’, which gathers metrics from a target that is executing the Node Exporter agent, which makes system metrics available on Linux systems. The frequency at which Prometheus should scrape metrics from the target is specified by the scrape interval, which is set at 15 seconds.
Code Example 2: Creating a Grafana Dashboard to Visualize Metrics
{
  "dashboard": {
    "id": null,
    "title": "Node Exporter Metrics",
    "panels": [
      {
        "title": "CPU Usage",
        "type": "graph",
        "datasource": "Prometheus",
        "targets": [
          {
            "expr": "100 - (avg by (instance) (irate(node_cpu_seconds_total{mode='idle'}[5m])) * 100)",
            "legendFormat": "{{instance}}",
            "refId": "A"
          }
        ]
      },
      {
        "title": "Memory Usage",
        "type": "graph",
        "datasource": "Prometheus",
        "targets": [
          {
            "expr": "node_memory_MemTotal_bytes - (node_memory_MemFree_bytes + node_memory_Buffers_bytes + node_memory_Cached_bytes)",
            "legendFormat": "Used",
            "refId": "A"
          }
        ]
      }
    ],
    "time": {
      "from": "now-6h",
      "to": "now"
    }
  },
  "folderId": 1,
  "overwrite": false
}
In this example, a JSON configuration defines a Grafana dashboard with panels to visualize CPU usage and memory usage metrics collected by Prometheus. The dashboard queries Prometheus as a data source and displays graphs showing the metrics over time.
4.2 Logging with Fluentd and Elasticsearch
Fluentd operates as an open-source data collector, pivotal for establishing a unified logging layer. Meanwhile, Elasticsearch, a distributed search and analytics engine, frequently collaborates with Fluentd to efficiently store and retrieve log data. Through their symbiotic partnership, Fluentd and Elasticsearch deliver a scalable and robust solution, ideal for centralizing logging operations.
Code Example 3: Configuring Fluentd to Collect Logs from Docker Containers
<source>
  @type forward
  port 24224
</source>

<match **>
  @type elasticsearch
  host elasticsearch
  port 9200
  logstash_format true
</match>
In this example, a source for gathering logs from Docker containers using the forward input plugin is defined in a Fluentd configuration file. The elasticsearch output plugin is then used to transport the logs to Elasticsearch, where they are indexed for searching and analysis.
This chapter has covered the fundamentals of logging and monitoring and has included practical code examples utilizing Prometheus, Grafana, Fluentd, and Elasticsearch to demonstrate how they are implemented. Organizations may increase reliability and performance by proactively identifying problems, gaining insight into the health and performance of their applications and infrastructure, and making data-driven choices by putting strong monitoring and logging systems in place. We’ll explore further facets of DevOps in the upcoming chapters and offer more advice on applying DevOps techniques in practical settings.


Leave a Reply